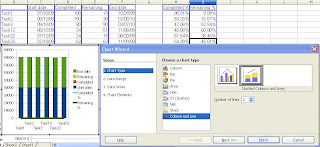
Here is a simple Gantt Chart template constructed with Open Office.

This also shows the percentage of task completed!
Steps are outlined as below.
Date and time are in MM/DD/YY format.
To calculate the end date in Cell F2 enter the formula
=C2+D2+E2
To calculate the completed task percentage in cell H2 enter the formula
=D2/(D2+E2) and then click the % shortcut on the toolbar.
2. Once the adhoc data is created we now commence to create the Gantt chart as follows
a. Select the table and on the Insert Menu, select Chart...
b. With the helpful chart wizard

i. Choose the Columns and Lines Chart type
ii. Choose the Number of Lines to plot 2 , this will display the last 2 columns in the table as Line charts.
iii.Check if your data range and headers are correct, optionally if series are in rows and not columns, edit here, rather than transpose.
iv. Remove any unnecessary data ranges, usually less clutter is more meaningful .
v. Edit the axis titles and legends
vi. Click Finish
And there you have it, a beautiful Gantt chart appears. It now only remains to do the appropriate chart formatting which will be shown in the next article. Till then adieu.

No comments:
Post a Comment